
Home / Services / Data & Analytics Service · Data & Analytics

Data Analytics
Services in the
Philippines

Turn raw data into KPI dashboards, clear reports, and forecasts
you can actually act on. We build the analytics layer your
business has been missing.
Data & Analytics

The bottom line

What you get

VeridaTech's data analytics services take the numbers your business already produces (sales, stock, cash, day-to-day operations) and turn them into dashboards and reports that show what is happening and what to do about it. It is built for owners and managers who have plenty of spreadsheets but not much clarity. And you can have us work onsite with your team or fully online, whichever suits you.

What is business data analytics?

Business data analytics means collecting, cleaning, and studying your company’s data to answer real questions and guide decisions. Instead of guessing why sales dipped last quarter or which products actually make money, you look at the evidence, laid out in reports and dashboards your team can read without a manual.

There are really four kinds of questions it answers. Descriptive analytics tells you what happened, like last month’s revenue by branch. Diagnostic analytics digs into why, such as the product line that quietly dragged the total down. Predictive analytics looks ahead and projects demand for the coming quarter. Prescriptive analytics goes one step further and points at what to do next: reorder now, or hold. We work across all four. That said, most small and mid-sized businesses see the fastest payoff from the basics, which is clean reporting and live dashboards that replace the manual spreadsheets eating up everyone’s week.

None of it is about a prettier chart. It is about making a faster, more confident call from numbers you can trust.

What is a KPI dashboard?

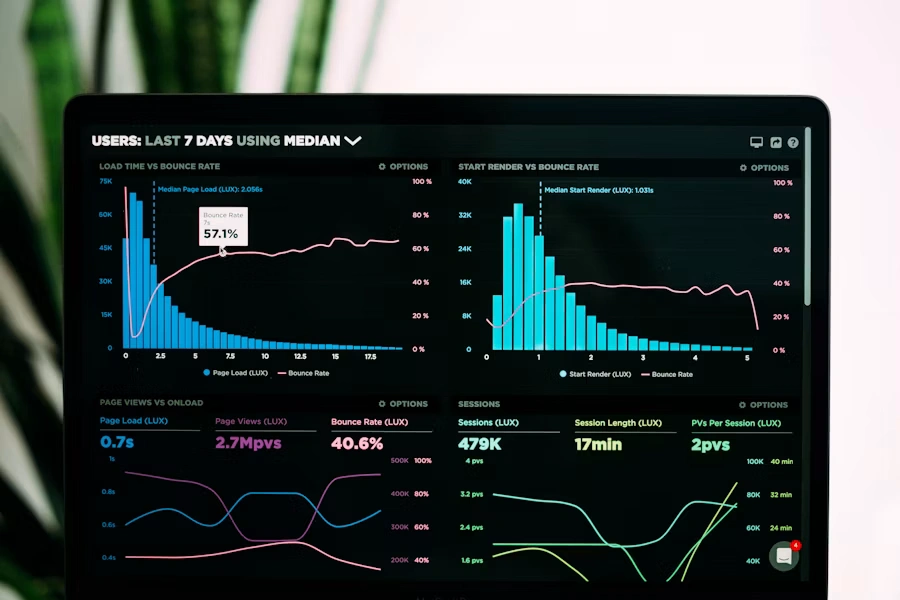
A KPI dashboard is a single screen showing your most important business metrics, updated automatically as new data comes in. KPI just stands for key performance indicator, the small set of numbers that tell you whether the business is on track: monthly revenue, gross margin, cash on hand, units shipped, whatever matters most to you.

The whole point is to stop rebuilding the same summary in five different spreadsheets every week. You get one live view, readable at a glance by anyone who needs it. Good dashboards are fussy about what they include. Five to ten numbers that drive decisions, and nothing else cluttering the screen. That is the kind we build: quick enough for an owner to scan in ten seconds, detailed enough to dig into when something looks off.

All Services

Our Data Analytics Services

Everything below works as a one-off project or as part of an ongoing package. Pick what you need, or tell us the problem and we will scope something around it.

Dashboards & Reporting

KPI dashboard creation
Live dashboards tracking the few metrics that actually move your business (revenue, margin, cash, output), refreshed automatically as new data lands.
Data analysis & reporting
We turn raw exports into clear, scheduled reports that explain what happened and why, so meetings start from facts instead of hunches.
KPI formulation
Not sure what to measure? We help you settle on the right metrics for your goals, so you track what drives decisions and skip the vanity numbers.
Performance monitoring
Ongoing tracking of team, branch, and business performance against targets, with a heads-up when something drifts off course.
Survey & feedback analysis
We pull clear themes and numbers out of survey, review, and customer-feedback data, so what your customers are telling you turns into something you can act on.
Power BI & Looker Studio dashboards
Interactive, enterprise-grade dashboards for teams that have outgrown static spreadsheets and need filters, drill-downs, and shareable live views.

Forecasting & Analysis

Forecasting & trend analysis
We project future sales, demand, and cash flow from your own history, so you can plan inventory, staffing, and budgets with a real number behind you instead of a guess.
Inventory & logistics analysis
A clear read on stock levels, lead times, reorder points, and supply bottlenecks, so less cash sits tied up in inventory and you still never run out of what sells.
Productivity tracking
We measure actual output and efficiency across teams and processes, giving managers something solid to base capacity and hiring calls on.

Process & Data Foundations

Business process analysis
We map how work really flows through your business today and flag the steps quietly costing you time, money, or accuracy.
Workflow optimization
We redesign the bottleneck steps for speed and reliability, then measure before and after so the improvement is provable, not just a feeling.
Data cleaning & validation
The unglamorous groundwork behind every good report. We consolidate scattered files, fix messy formatting, and check the numbers before any analysis starts.

Who is this for?

Our data analytics services are built for small and mid-sized businesses sitting on plenty of data with nobody in-house to make sense of it. If your reports are scattered across a tangle of spreadsheets, if month-end drags on for days, or if you are making big calls on instinct because the numbers are too messy to trust, you are the reason this service exists. A few situations we run into a lot:

Retail & e-commerce

Owners who want best and worst sellers, margin by category, and low-stock warnings in one live view instead of five separate exports.

Professional & service firms

Agencies, clinics, and consultancies watching billable output, utilization, and client profitability who want one dashboard the whole team trusts.

Operations & logistics teams

Managers tracking throughput, lead times, and cost per unit who would rather catch a bottleneck early than find it at quarter-end.

Founders & finance leads

Decision-makers who need one honest, current picture of cash, revenue, and performance to steer the business and brief a lender or investor.

Signs your business is ready for analytics help

You do not have to be a “data company” to get value here. Usually it is time to bring in help when a few of these sound familiar:

  • Month-end reporting takes days, and people still argue about the numbers.
  • Your data lives in a dozen spreadsheets only one person really understands.
  • You are making pricing, hiring, or inventory calls on gut feel because the data is too messy to trust.
  • You can see what happened but never find time to work out why.
  • Two reports give you two different answers to the same simple question.


If two or more of those landed, a focused dashboard and cleanup project tends to pay for itself pretty quickly in saved time and avoided mistakes.

How we work

Our Data Analytics Process

A clear five-step path from messy data to a dashboard you actually rely on. No jargon, no black boxes.

01

Discovery & goals

We start with the decisions you are trying to make, not the data. A short working session nails down the questions your dashboard has to answer and the metrics that matter to you.

02

Data audit & cleaning

We gather your sources, whether that is exports, spreadsheets, or system reports, then consolidate, clean, and validate them so everything built afterward stands on numbers you can trust.

03

Build

We design and build the dashboards, reports, and models in Excel, Google Sheets, Power BI, or Looker Studio, whichever fits how your team already works.

04

Review & handover

We walk you through the finished product, explain what each number means, and refine it against your feedback until it genuinely fits how you decide things.

05

Ongoing support

Data shifts and so do your questions. We keep dashboards current, add metrics as you grow, and stay on call for the analysis behind your next big decision.

Why acting on data pays off

Businesses that decide with data tend to outperform the ones running on instinct. The research here is pretty blunt, and it is a big part of why analytics stopped being a luxury reserved for large companies.

23x

more likely to acquire customers

6x

more likely to retain customers

19x

more likely to be profitable

Figures for data-driven organizations, McKinsey Global Institute. In a separate BARC survey, businesses using their data reported an 8% average lift in profit and a 10% cut in costs, with 69% pointing to better strategic decisions.

The catch is that these gains go to the businesses that can actually use their data, not the ones sitting on exports nobody has time to open. Closing that gap for smaller companies is basically our whole job. It is the kind of clarity big firms pay data teams for, minus the big-firm budget or headcount.

The VeridaTech Difference

Why choose VeridaTech for data analytics services

Plenty of firms will hand you a chart. Here is what makes our analytics work different.

Onsite and online

We are based in the Philippines and can sit with local businesses in person or work fully remotely with clients in Australia, the US, and the UK. Most remote-only providers cannot offer both.

Built in your tools

Excel, Google Sheets, Power BI, or Looker Studio. We build where your team already works, so there is nothing new to learn and no extra subscription to sign up for.

Insight, not just reports

We tell you what the numbers mean and what to do about them. That "so what" is the difference between a real analyst and a chart generator.

Clear visuals, not noise

Dashboards designed to be understood at a glance, not to show off. If a chart does not help you decide something, it does not make the cut.

One team, many needs

Analytics, spreadsheets, bookkeeping, and research under one roof. When your numbers raise a finance question, someone who can answer it is already on your team.

Trustworthy foundations

Backed by a Xero-certified finance and bookkeeping team, we take accuracy seriously. A confident decision built on a wrong number is worse than no decision at all.

Tools & platforms we work with

We are tool-agnostic and meet your data where it already lives, instead of forcing a migration.

Microsoft Excel
Google Sheets
Microsoft Power BI
Looker Studio
CSV & system exports
Point-of-sale data
Accounting exports
CRM reports

Questions

Data analytics FAQ

How much do data analytics services cost in the Philippines?

We price analytics work by project scope or as a monthly package, not by a fixed hourly rate. A single KPI dashboard costs less than an ongoing reporting and monitoring setup. Every quote is custom, because the number really depends on how many data sources are involved, how clean your data is, and how often you need it refreshed. Check our pricing page for package tiers, or ask for a quote and we will give you an exact figure.

Both. We are based in the Philippines, so we work onsite for local SMEs who like collaborating in person, and fully online for clients in Australia, the US, and the UK. That hybrid setup is our main difference from remote-only BPOs.

The ones you already use: Microsoft Excel, Google Sheets, Power BI, and Looker Studio. We will not push you onto some proprietary platform or a subscription you do not need. If your team lives in spreadsheets, you get a spreadsheet dashboard. If you need heavier interactivity, we build in Power BI or Looker Studio.

A focused single-dashboard project usually runs one to two weeks from kickoff to handover, assuming the source data is ready. Most of the timeline comes down to data readiness. Clean, well-structured data moves quickly, while messy or scattered data needs a cleaning pass first.

No, cleaning and validation is part of the job. Most businesses come to us with messy exports, inconsistent formatting, and data spread across a bunch of files. We consolidate, clean, and check all of it before building anything, so the numbers you act on hold up.

A report is a static snapshot of what happened over a set period. A dashboard is a live, visual view that updates as new data arrives, so you can watch performance day to day. We build both, and often pair them: scheduled reports for the record, dashboards for the decisions.

Yes. We connect to and build on top of whatever you already run, including accounting exports, point-of-sale data, and CRM reports. Nothing needs to be migrated for us to get started.

Both. We serve Philippine SMEs onsite and online, and we work remotely with clients in Australia, the US, and the UK across time zones. Dashboards, reports, and analysis get delivered in whatever format and cadence each client wants.

Yes. Your data stays strictly confidential, and we are glad to sign an NDA. Only the team members working on your project get access, and we can delete source files once we are done if you would like.

Definitely. If you would rather run the dashboards yourself afterward, we build them to be maintainable and walk your team through refreshing the data and making small changes. Plenty of clients start with a build-and-train project and only keep us around for the bigger analysis later.