
A business may track sales, expenses, customer activity, and employee performance in separate spreadsheets. The problem comes when managers need to understand how those numbers relate to business performance.
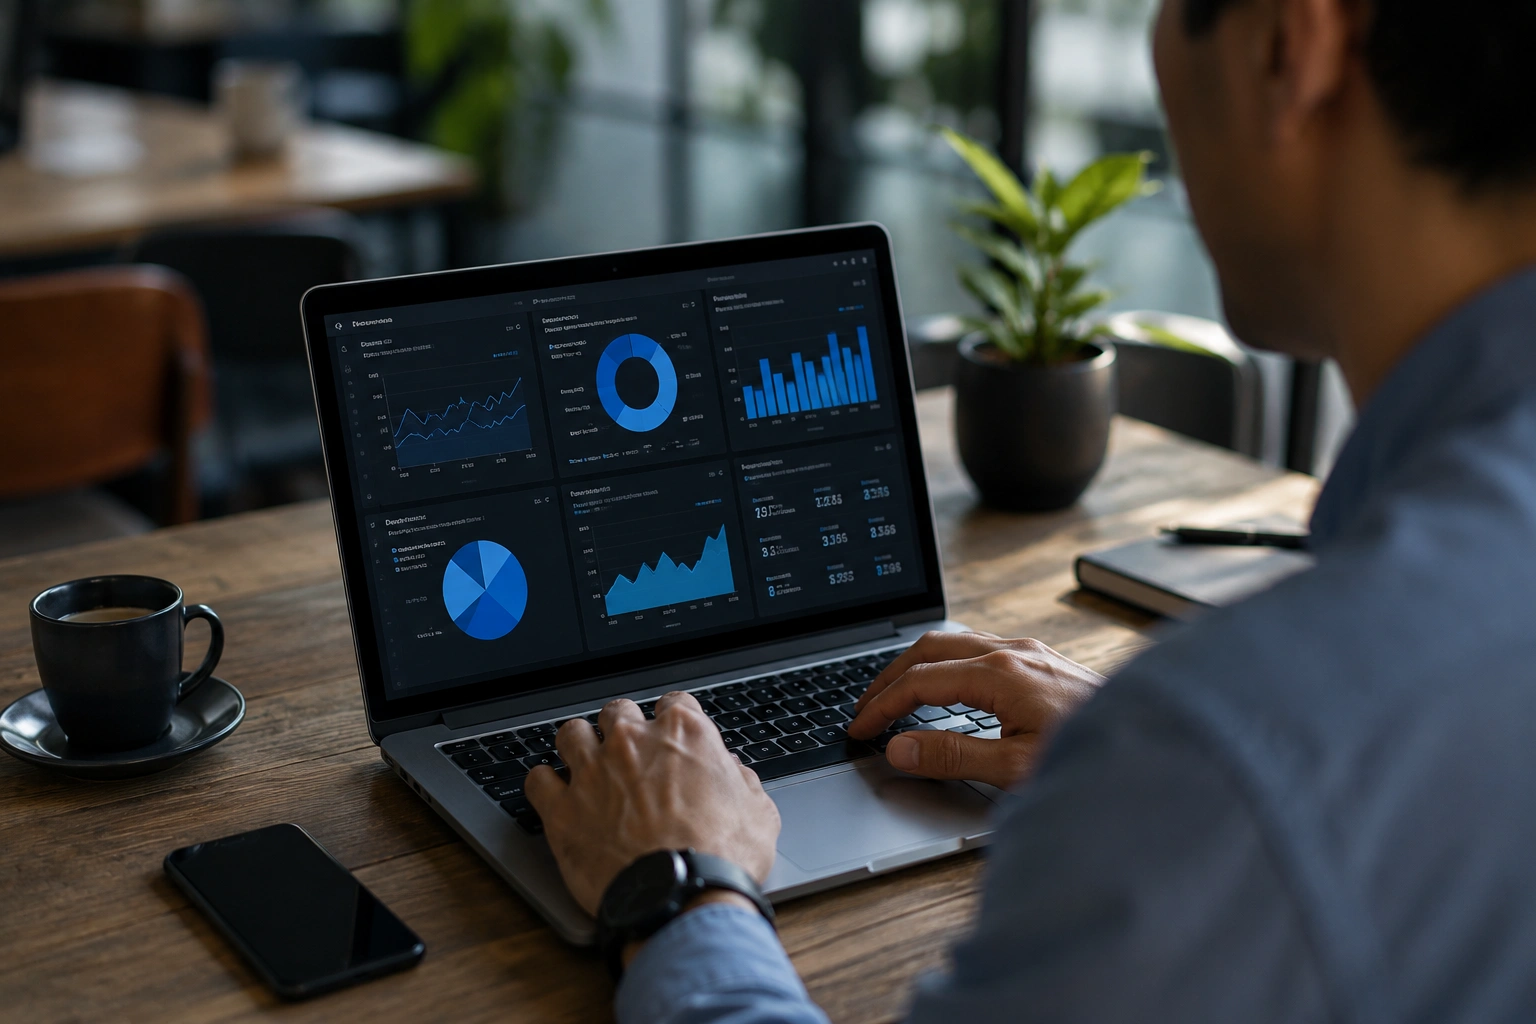
So, what is a KPI dashboard? It is a visual reporting tool that displays a company’s most important key performance indicators (KPIs) in one place. It helps business owners and managers monitor progress, compare results against targets, and identify areas that need attention.
For businesses in the Philippines and worldwide, KPI dashboards can make regular reporting easier to manage. VeridaTech, a Philippines-based finance and data analytics business, helps organizations organize information and prepare reports that support business decisions.
This guide explains the what is a KPI dashboard, how dashboards work, which metrics to include, and how to create one using commonly available reporting tools.
Quick Answer: What Does a KPI Dashboard Do?
A KPI dashboard organizes selected performance measures into charts, tables, and numerical summaries so businesses can monitor results without reviewing multiple reports.
Key points to understand:
- A KPI dashboard tracks measurable business goals, such as revenue, profit margin, customer retention, and operating expenses.
- Dashboards display performance through charts, scorecards, tables, and comparisons against targets.
- Common tools include Microsoft Excel, Microsoft Power BI, Google Sheets, and Looker Studio.
- Reliable dashboards require accurate source records, consistent KPI formulas, and an appropriate reporting schedule.
- A dashboard supports decision-making, but its usefulness depends on the quality of the information and the actions taken afterward.
What Is a KPI Dashboard and How Does It Work?
A KPI dashboard is a reporting interface that presents selected key performance indicators in a visual format. Each indicator measures progress toward a specific business objective.
For example, a retail business might monitor monthly revenue, gross profit margin, average transaction value, and inventory turnover.
Rather than reviewing separate spreadsheets for each metric, management can examine the results through one business dashboard.
The process generally involves collecting data, calculating KPIs, displaying results, and updating the information according to a reporting schedule.
How Does a KPI Dashboard Turn Data Into Information?
A dashboard typically follows four stages:
- Data collection. Information comes from sales records, accounting systems, inventory files, customer relationship management platforms, or spreadsheets.
- Data preparation. Records are checked for errors, missing values, inconsistent formats, and duplicate transactions.
- KPI calculation. The system applies defined formulas to calculate measures such as revenue growth or profit margin.
- Visualization. Results appear in charts, tables, scorecards, or progress indicators.
Consider a business with a monthly revenue target of ₱500,000.
If actual revenue reaches ₱450,000, its target achievement rate is:
\[ \frac{450,000}{500,000}\times100=90\% \]
The dashboard could display 90% target achievement and a ₱50,000 shortfall.
That information gives management a starting point for reviewing sales activity and identifying possible reasons for the difference.
What Is the Difference Between a KPI and a KPI Dashboard?
A KPI is an individual measure of business performance. A KPI dashboard is the reporting tool used to display and monitor several KPIs together.
For example, monthly revenue is a KPI. A dashboard may show monthly revenue alongside expenses, gross profit margin, and customer acquisition figures.
| Feature | KPI | KPI dashboard |
| Purpose | Measures a particular result | Displays multiple performance measures |
| Format | Number, percentage, or rate | Charts, tables, and scorecards |
| Example | Monthly revenue of ₱450,000 | Sales dashboard showing revenue, targets, and trends |
| Business use | Evaluates one objective | Supports broader performance reviews |
| Updates | Based on reporting requirements | Based on connected or manually updated data |
A key performance indicator dashboard is most useful when each KPI has a defined purpose.
For example, tracking website visits may help a marketing team assess traffic, but it does not necessarily indicate whether the company is generating profitable sales.
The right metrics depend on the business objectives.
What KPIs Should a Business Dashboard Include?
A business dashboard should contain KPIs directly related to the decisions managers need to make.
A small business may begin with five to eight relevant measures rather than tracking every available number.
The appropriate KPIs depend on the industry, operating model, and reporting requirements.
Financial Performance KPIs
Financial KPIs help businesses review revenue, profitability, costs, and liquidity.
Common examples include:
- Revenue. Total income generated from the business’s ordinary activities during a reporting period.
- Gross profit margin. The percentage of revenue remaining after deducting cost of goods sold.
- Operating expenses. Costs incurred through normal business operations.
- Net profit margin. Net profit expressed as a percentage of revenue.
- Accounts receivable aging. Outstanding customer balances grouped according to how long they have remained unpaid.
Gross profit margin is calculated as:
Revenue-CostofGoodsSoldRevenue100
Suppose a business generates ₱800,000 in revenue and reports ₱500,000 in cost of goods sold.
Its gross profit margin is 37.5%.
This calculation helps management understand how much revenue remains after direct costs, before other operating expenses.
Sales and Marketing KPIs
Sales and marketing dashboards measure how effectively a business generates and converts opportunities.
Relevant KPIs include:
- Sales growth rate.
- Number of qualified leads.
- Lead-to-customer conversion rate.
- Average order value.
- Customer acquisition cost.
For example, if 40 customers are acquired from 200 qualified leads, the lead-to-customer conversion rate is 20%.
However, businesses should define what qualifies as a lead and apply that definition consistently.
Operations and Customer Service KPIs
Operational KPIs help managers monitor the efficiency and consistency of business processes.
Examples include:
- Order fulfillment time.
- Inventory turnover.
- On-time delivery rate.
- Customer complaint resolution time.
- Employee productivity measures.
A distribution business might track on-time delivery rates weekly, while a professional services company may monitor project completion and billable utilization.
Different departments may need separate dashboards because their responsibilities and decisions differ.
Who Can Benefit From a KPI Dashboard?
KPI dashboards are useful for businesses that need to monitor performance regularly and make decisions based on consistent measurements.
They can serve different roles.
Small and Medium-Sized Businesses
Small business owners often manage sales, expenses, staffing, and operations with limited reporting resources.
A dashboard can combine selected measures into one place, reducing the need to manually examine several spreadsheets.
For example, a Philippine retail business might review daily sales, weekly inventory movement, and monthly profitability.
Finance and Accounting Teams
Finance teams may use dashboards to monitor cash balances, expense categories, accounts receivable, and budget variances.
These dashboards should draw from reviewed financial records whenever possible.
For companies struggling with inconsistent transaction records, bookkeeping and finance support may be needed before preparing reliable financial dashboards.
Sales and Operations Managers
Sales managers can use dashboards to review targets, pipeline activity, and conversion rates.
Operations managers may focus on delivery times, inventory availability, order accuracy, and process completion.
The goal is to present information each manager can use in routine performance reviews.
What Data Do You Need to Build a KPI Dashboard?
A dashboard needs reliable source data, clearly defined metrics, and an appropriate update schedule.
The starting point is identifying which business questions the dashboard should answer.
For example, a business owner might ask whether monthly revenue is increasing, whether expenses remain within budget, or which products generate the highest gross profit.
Once those questions are clear, the relevant source records can be identified.
| Data source | Information it may provide |
| Sales invoices and transaction exports | Revenue, transactions, and customer purchases |
| Accounting records | Expenses, profitability, and account balances |
| Inventory records | Stock quantities and inventory movement |
| CRM exports | Leads, customer interactions, and sales opportunities |
| Employee or project records | Workload, completion rates, and productivity |
| Budget worksheets | Planned amounts and actual-versus-budget comparisons |
Each source should have an assigned owner responsible for maintaining or reviewing the information.
For international businesses, currency and reporting periods also matter. A dashboard combining Philippine peso and Australian dollar transactions should apply an explicitly defined currency conversion method rather than simply adding the amounts together.
How Do You Build a KPI Dashboard Step by Step?
Creating a dashboard involves more than selecting charts. You need to decide what should be measured, confirm the data, and test whether the output answers your business questions.
Step 1: Define Your Business Objectives
Begin with the decisions the dashboard should support.
For example, an operations manager may want to reduce late deliveries, while a finance manager may need to identify expense categories exceeding budget.
Each objective should have measurable indicators.
Step 2: Select the Right KPIs
Choose KPIs that directly relate to your objectives.
For every metric, document its formula, reporting period, source, target, and responsible person.
This prevents teams from calculating the same measure differently.
Step 3: Collect and Clean Your Data
Review source records for missing values, duplicate entries, inconsistent dates, and incorrect classifications.
Compare summary totals with original records whenever possible.
A dashboard built on inaccurate data may display convincing charts while producing misleading results.
Step 4: Choose a Reporting Tool
Select a tool based on data volume, reporting frequency, collaboration requirements, and available technical skills.
Microsoft Excel may suit small datasets and manually maintained dashboards. Microsoft Power BI and Looker Studio can support more extensive reporting needs, depending on the connections and features required.
Step 5: Design and Test the Dashboard
Place the most important metrics where users can find them easily.
Use clear titles, appropriate chart types, and consistent units.
Before sharing the dashboard, verify calculations, filters, dates, and source totals.
For more detailed instructions, read VeridaTech’s guide on how to build a KPI dashboard for better reporting.
What Tools Can You Use to Create a KPI Dashboard?
Several reporting tools can create KPI dashboards. The best choice depends on your reporting requirements and existing systems.
| Tool | Suitable use |
| Microsoft Excel | Spreadsheet-based reporting and calculations |
| Google Sheets | Collaborative spreadsheet dashboards |
| Microsoft Power BI | Business intelligence reporting and interactive analysis |
| Looker Studio | Browser-based reports with supported data connectors |
Microsoft Power BI provides dashboards in the Power BI service that bring selected visualizations together on a single page. Its reports offer additional filtering and analysis capabilities.
Looker Studio allows users to connect supported data sources and create charts or controls within reports.
The tool should fit the business’s existing reporting process. A small company using a carefully maintained Excel workbook may not need a more complicated system immediately.
What Is the Difference Between a KPI Dashboard and a Report?
A KPI dashboard summarizes selected performance indicators, while a report generally provides more detailed information and supporting analysis.
Dashboards help answer questions such as whether sales met their target or whether expenses increased.
Reports can explain which transactions, customers, products, or departments contributed to those results.
A dashboard might show that monthly revenue declined by 8%. A sales report could identify the product categories or customer segments associated with the decline.
Both serve useful purposes.
VeridaTech also discusses this distinction in its article on dashboard vs. report.
What If Your Dashboard Shows Incorrect or Incomplete Data?
Incorrect dashboards often result from problems in the underlying records, formulas, or refresh processes.
Common issues include:
- Duplicate transactions that overstate revenue.
- Missing expense records that affect profitability.
- Inconsistent date formats that place transactions in the wrong period.
- Incorrect formulas or classifications.
- Failed data refreshes that leave old figures on the dashboard.
The first step is to identify the affected metric and compare it against its source records.
For example, if a dashboard shows ₱600,000 in monthly sales but the approved sales report shows ₱570,000, investigate the ₱30,000 difference.
Check transaction dates, duplicates, refunds, and calculation rules.
For recurring discrepancies, a documented reconciliation process can help ensure that reported values match the agreed source data.
How Often Should You Update a KPI Dashboard?
A KPI dashboard should be updated according to how frequently its measures change and how often decisions depend on those results.
Daily updates may be appropriate for sales transactions or order fulfillment. Monthly updates may be sufficient for profitability, expense analysis, and budget reviews.
A frequently refreshed dashboard is not automatically more useful.
For example, a monthly gross profit margin dashboard may contain incomplete information if cost records have not yet been reviewed.
The business should establish when source data becomes available, who validates it, and when the dashboard is ready for management review.
How Long Does It Take to Create a KPI Dashboard?
Dashboard development time depends on the number of metrics, source systems, data quality, and level of reporting detail required.
A simple spreadsheet dashboard using clean, organized data generally requires less work than a dashboard combining accounting, inventory, and customer management records.
The work commonly includes reviewing requirements, preparing data, calculating measures, designing visualizations, testing results, and documenting updates.
If source records are incomplete, data preparation may require more effort than designing the charts.
Project scope should therefore be assessed before setting a completion schedule.
How Can VeridaTech Help With KPI Dashboards?
VeridaTech provides data and analytics services to help businesses organize information, define useful measures, and prepare business reports.
As a Philippines-based business, VeridaTech supports clients online worldwide, including businesses in Australia, the United States, and the United Kingdom. Onsite service arrangements in Bataan, Pampanga, Bulacan, and Metro Manila are subject to confirmed coverage.
Depending on project requirements, its data analytics services can involve reviewing existing reporting processes, preparing source data, defining KPIs, developing dashboards, and documenting reporting procedures.
For a business beginning its first dashboard project, a useful starting point is identifying the most important decisions management needs to make each week or month.
The dashboard can then be designed around those specific information needs.
Frequently Asked Questions About KPI Dashboards
What is the main purpose of a KPI dashboard?
The main purpose of a KPI dashboard is to help businesses monitor performance against defined objectives. It displays selected measures in one place, allowing managers to identify changes, compare results with targets, and determine which areas require attention. For example, a sales dashboard may show revenue, conversion rates, and target achievement. Its usefulness depends on accurate data and consistent definitions, since incorrect information can lead managers toward inappropriate decisions.
What is an example of a KPI dashboard?
A retail KPI dashboard might display daily revenue, gross profit margin, average transaction value, inventory turnover, and sales performance against targets. A business owner could use these figures to review whether sales are increasing and whether stock levels support expected demand. The dashboard may include charts showing weekly trends and numerical indicators showing monthly results. The measures should match the business’s operations and reporting priorities.
Can small businesses use KPI dashboards?
Yes. Small businesses can use KPI dashboards even when they have limited reporting resources. A basic dashboard created in Microsoft Excel or Google Sheets may be sufficient for monitoring sales, expenses, and customer activity. Businesses should start with a small number of relevant KPIs and clearly define how they are calculated. As reporting needs become more complicated, additional automation or reporting tools may become useful.
Is a KPI dashboard the same as a business dashboard?
A KPI dashboard is a type of business dashboard focused specifically on measuring progress against important objectives. A business dashboard can include broader operational information, such as transaction counts, inventory lists, schedules, and general statistics. In practice, the terms often overlap. The main distinction is whether the displayed measures are linked to defined performance goals and management decisions.
Can a KPI dashboard update automatically?
Yes. Some dashboards can update through connected data sources and scheduled refresh processes. Microsoft Power BI and Looker Studio support data connections, while Excel dashboards can also use supported refresh features and automation. Automatic updating depends on the software, connection settings, access permissions, and source system. Businesses should still monitor refresh errors and verify important results, since automation does not guarantee accurate source information.
How many KPIs should a dashboard have?
There is no fixed number of KPIs that every dashboard should contain. A small business may find five to eight carefully chosen measures sufficient for an initial management dashboard. The appropriate number depends on the users and decisions involved. Too many indicators can make important results harder to identify. Each measure should have a clear definition, reliable data source, and practical reason for appearing on the dashboard.
What makes a KPI dashboard effective?
An effective KPI dashboard presents accurate, relevant information in a format that users can understand quickly. It should use consistent formulas, clearly labeled units, appropriate visualizations, and meaningful comparisons against targets or previous periods. The dashboard should also show when the information was last updated. Most importantly, each measure should help answer a business question rather than simply fill space on the screen.
Do businesses need professional help to create KPI dashboards?
Not always. Businesses with clean records and straightforward reporting needs may create basic dashboards using existing spreadsheet software. Professional support may become useful when reports draw information from several systems, require complicated calculations, or contain recurring inconsistencies. Before requesting assistance, businesses should identify their objectives, available source records, required KPIs, and reporting schedule. This makes it easier to determine the appropriate project scope.
Make Your Business Reporting Easier With VeridaTech
Understanding what is a KPI dashboard helps you identify which business measures deserve regular attention. A useful dashboard starts with clear objectives, accurate records, and well-defined calculations.
VeridaTech provides data and analytics services for businesses in the Philippines and worldwide. If your company needs help organizing information or developing a dashboard for its reporting requirements, contact VeridaTech to discuss your project.